.png.7b01ce7357a7730d478c6dae8134de1b.png)
Rousseau
-
Posts
21,175 -
Joined
-
Last visited
-
Days Won
226
Everything posted by Rousseau
-
.thumb.png.933227737d9b1db3d025cd3f6cbbf371.png) And God said*, “Let there be xG,” and there was xG. God saw that the xG was good, and he separated the xG from the xGA. God called the xG “Goals For,” and the xGA he called “Goals Against.” And there was attack, and there was defence—the first chance. *Probably
And God said*, “Let there be xG,” and there was xG. God saw that the xG was good, and he separated the xG from the xGA. God called the xG “Goals For,” and the xGA he called “Goals Against.” And there was attack, and there was defence—the first chance. *Probably -
I still think you're mistaken. They're only accurate if you include as many chances as possible. We can't pick and choose. It renders the metric meaningless.
-
What about, 'xG is the best thing since sliced bread'?
-
Match Thread [FT] Servette 1 - 1 Rangers (Tavernier 51)
Rousseau replied to BlackSocksRedTops's topic in Rangers Chat
I've got the fear... -
You're mistaken. You can't apply xG to players. Only the chance. And then once you start picking and choosing data to fit, it doesn't work.
-
Match Thread [FT] Servette 1 - 1 Rangers (Tavernier 51)
Rousseau replied to BlackSocksRedTops's topic in Rangers Chat
That's my preferred team - albeit with Lammers for Sima, but you can MB wanting some pace on the counter. -
Match Thread [FT] Servette 1 - 1 Rangers (Tavernier 51)
Rousseau replied to BlackSocksRedTops's topic in Rangers Chat
Yes: he's been injured for the past two years! -
This is mistaken. You can't just pick and chose. This makes a mockery of the stats: 'this lad took a shot, but it's in the Champions League so it's actually worth three shots...' I think the data analysts are in a better position than us to judge the value of the data and metrics.
-
I meant how many games have you watched to come to that judgement? I can guarantee the xG model has watched more games. Your judgement is subjective. The xG model objectively tells us how many times a player has scored a goal in that situation: 41%. We've both watched the same shot; you think it's a sitter, I think it's a little tricky. We're both using our own judgement. Are we both right? Both wrong? I'm revising my judgement after seeing such a high xG. There are many variables that cause a player to not score: they're shit, the 'keeper pulls off a worldie, doesn't connect properly, slips, etc, etc. It happens. In a perfect situation he'll score, but football is an imperfect game, played by flawed humans. He definately should score. The xG says so: its a high xG. A penalty, for comparison, is 0.79. Players should be scoring penalties, but they don't. That's just a fact. Like I said, I've seen players sky a shot from one yard out. It's inconceivable that they could miss, yet they did. It happens. They won't be including Sunday league football. Having a range of levels is beneficial, though. You need a spectrum of data to find the most accurate average. I disagree that it won't 'accurately reflect [...] chances at the [top] level', but even if we accept that, you'd just factor in a little tolerance. Even then it won't fluctuate wildly from the numbers, IMO.
-
It's just the quality of the chance. It's got nothing to do with the player or the defence. Like I've said before, if you give have Haaland and Sebo taking the same chance, one will score, one won't (Haaland ). The best players will score from low xG chances; that's why they are the best. The quality of the chance remains the same, though: on average and player in x position scores y% of the time.
-
Match Thread [FT] Servette 1 - 1 Rangers (Tavernier 51)
Rousseau replied to BlackSocksRedTops's topic in Rangers Chat
I don't think it's either/or: they can both play further forward with AN Other playing deeper. -
Match Thread [FT] Servette 1 - 1 Rangers (Tavernier 51)
Rousseau replied to BlackSocksRedTops's topic in Rangers Chat
It was more of a general point. I didn't really mean we should play him there for this game - although I now realise it's in the Servette match thread... -
Match Thread [FT] Servette 1 - 1 Rangers (Tavernier 51)
Rousseau replied to BlackSocksRedTops's topic in Rangers Chat
Yes, he scored a couple of goals in some games. It looks like he's a goal threat, but, for me, I just thought his energy in the final third could be useful. -
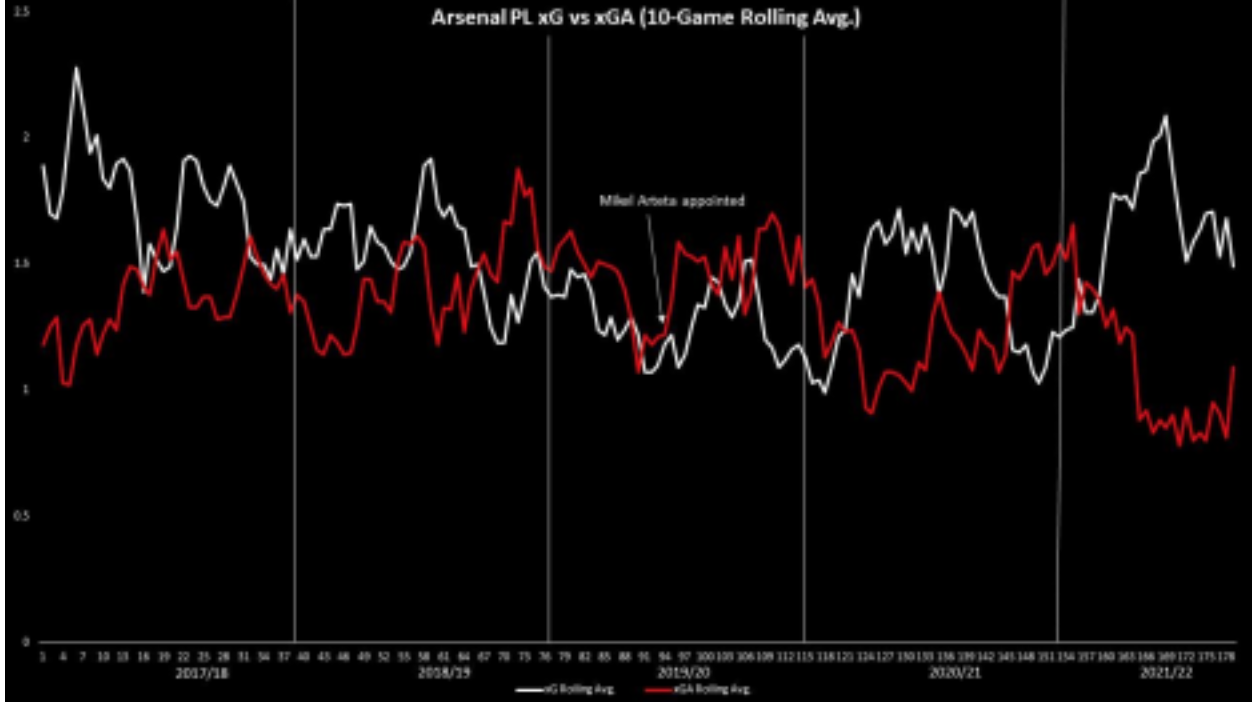
What I like is the xG graphs. It's the xG for and xG against, for every match. The red line is xG against and the white is xG for. It's a bad image, but it shows that when Arteta took over in 2019/20, he increases the chances they create and reduces the chances they concede. If you go with the xG it's no surprise that they pushed City last year. I'd love to see something like this for Rangers, but I've yet to see it.

-
It is indeed mind-blowing. I don't know, to be honest. Surely it's just another small step up from gambling sites? They track a mind-blowing amount of stuff, too. If it's not done by AI, is soon will be. Edit: From the Opta site: 'Opta data is generated in real-time though a combination of human annotation, computer vision and AI modelling. Through this parallel human and computer fused process, we are able to generate more in-depth and detailed performance data than ever before.'
-
I would - mainly because I didn't want him in the first place. That's not the same as calling for him to be sacked, though, is it? I also said it would be harsh to sack MB. (And the '[Manager X]'s still available. Just Saying' posts are tongue in cheek.)
-
You're taking the piss...
-
I found Lammers' shot xG: 0.34. Dessers' tap-in had an xG of 0.88. (For a base line, a penalty is 0.79 xG.) You say he should be scoring, but you've surely seen players miss from closer. I've seen players sky it from pretty much under the bar! As to your last point about 'enhanced his stats'. xG just described the quality of the chance, based on past shots - it's not applied to the player. Obviously, better players (Haaland) will over-perform the xG, because they can take chances that others wouldn't. On the opposite end of the spectrum, if someone is consistently under-performing their xG, they're p*sh. I used xG to defend Lammers' goalscoring record: Three goals in a season is poor, but his xG was 5, or something. He's under-performing, but it's not atrocious. It's not as if he should be scoring 25 goals from those 5 chances - no one can do that.
-
There are several data modelling companies, Opta being one. Football clubs will pay for the service - which includes far more data than I get from my wee preferred App. (The App I use gets its data from Opta, so they must be paying for that.) It should? I don't think so. Even Sima's goal at the weekend was similar, I'd say, but easier to score than Lammers' chance. It has an xG of 0.41 (I think - I can't remember exactly off the top of my head). 41% of the time players score that. It's quite high. That's what the data tells us. Remember: it's based on tens of thousands of shots. You say, 'it should be scored every single goddam time', but how many games is that based on? Can you say that with absolute objectivity. I actually think it was a tricky chance because it comes at him quite fast, from behind. It's difficult to get your legs sorted for that type of pass.
-
Match Thread [FT] Servette 1 - 1 Rangers (Tavernier 51)
Rousseau replied to BlackSocksRedTops's topic in Rangers Chat
It's interesting that you've got Raskin further forward, rather than as the 6 where he usually plays. Do you think he's better further forward? I do. Nobody seemed to agree with me, though. -
Match Thread [FT] Servette 1 - 1 Rangers (Tavernier 51)
Rousseau replied to BlackSocksRedTops's topic in Rangers Chat
4-2-3-1?! Why would you do this to me, TB? Why?! -
They were very good, though. They surprised me. If they play like that every week they'll be fine.
-
Match Thread [FT] Servette 1 - 1 Rangers (Tavernier 51)
Rousseau replied to BlackSocksRedTops's topic in Rangers Chat
Bugger... -
'xG' is specifically for football as far as I know. Probability models could be replicated anywhere, though. I could be wrong.
-
Yes, low blocks are sitting deep. I've tried to explain xG above: They take hundreds of thousands of past shots, going back decades, from every conceivable position on the pitch, and check how many times a player actually scored. In practice, that means if a chance has 0.2xG, it should be scored 20% of the time, because out of those hundreds of thousands of past shots they've looked at, the player actually scored 20% of the time. They take into account many more variables than just position on the pitch, e.g.: - Type of Assist - Distance to the goal - Angle to the goal - Did the player strike it with his feet or was it a header? - In what passage of play did it happen? (e.g. open play, direct free-kick, corner kick, counter-attack) - Has the player just beaten an opponent? We do it in our heads all the time, using our judgement and past experience of watching games, when we say, 'that's a sitter - he has to score that'. The xG tells you how many times players in the past have actually scored from that position - and taking into account all the other variables. An xG measurement can be generated for both teams as a whole and individual players, giving an indication as to how well they should be performing in front of goal. Combining a player or team's xG ratings during the course of a season can give an approximation of how many goals a they should have scored. Not only can that be used to evaluate a particular performance, it can also be used in the projection of a future or long-term performance.